
Data Analytics, Data Visualization, Data Sharing
The new digital world contain lot of data.
We help to understand it.
What is Power BI?
Power BI is a collection of software services, apps, and connectors that work together to turn your unrelated sources of data into coherent, visually immersive, and interactive insights.
Your data might be an Excel spreadsheet, or a collection of cloud-based and on-premises hybrid data warehouses. Power BI lets you easily connect to your data sources, visualize and discover what’s important, and share that with anyone or everyone you want.
The parts of Power BI
Power BI consists of several elements that all work together, starting with these three basics:
- A Windows desktop application called Power BI Desktop.
- An online software as a service (SaaS) service called the Power BI service.
- Power BI Mobile apps for Windows, iOS, and Android devices.
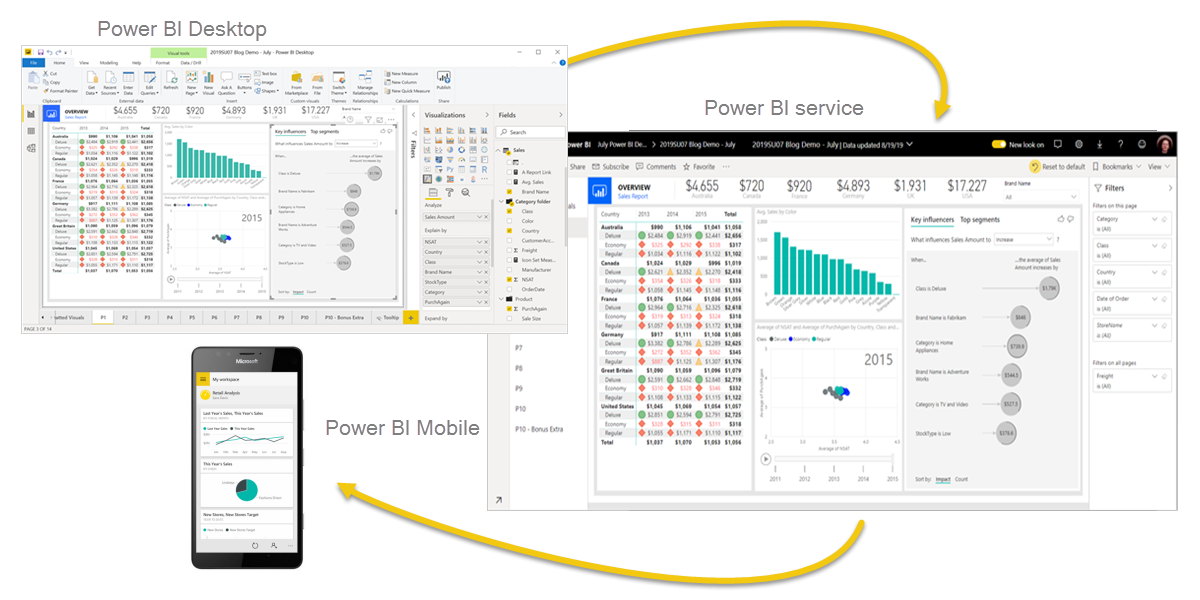
Create, share, and consume business insights in the way that serves you and your role most effectively.
Beyond those three, Power BI also features two other elements:
- Power BI Report Builder, for creating paginated reports to share in the Power BI service.
- Power BI Report Server, an on-premises report server where you can publish your Power BI reports, after creating them in Power BI Desktop.
How Power BI matches your role
Viewing reports and dashboards
Creating business-report and publishing
monitoring progress on sales quotas
Drilling into new sales lead details
If you’re a developer, you might use Power BI APIs to push data into semantic models or to embed dashboards and reports into your own custom applications. Have an idea for a new visual? Build it yourself and share it with others.
You also might use each element of Power BI at different times, depending on what you’re trying to achieve or your role for a given project.
For example, you can use Power BI Desktop to create reports for your own team about customer engagement statistics and you can view inventory and manufacturing progress in a real-time dashboard in the Power BI service. You can create a paginated report of mailable invoices, based on a Power BI semantic model. Each part of Power BI is available to you, which is why it’s so flexible and compelling.
How Microsoft Fabric works with Power BI
Microsoft Fabric is an offering that combines data + services in a unified environment, making it easier to perform analysis and analytics on various sets of data.
Power BI is an example of one of the services that’s integrated with Microsoft Fabric.
Your organization’s OneLake data store is an example of the data that can be used, analyzed, or visualized.
Large organizations find Microsoft Fabric particularly useful, since it can corral and then bring greater value to large stores of data, then using services (like Power BI) to bring such data to business life.
Administration of Power BI is now handled by Microsoft Fabric, but your favorite tools like the Power BI service and Power BI Desktop still operate like they always have – as a service that can turn your data, whether in OneLake or in Excel, into powerful business intelligence insights.
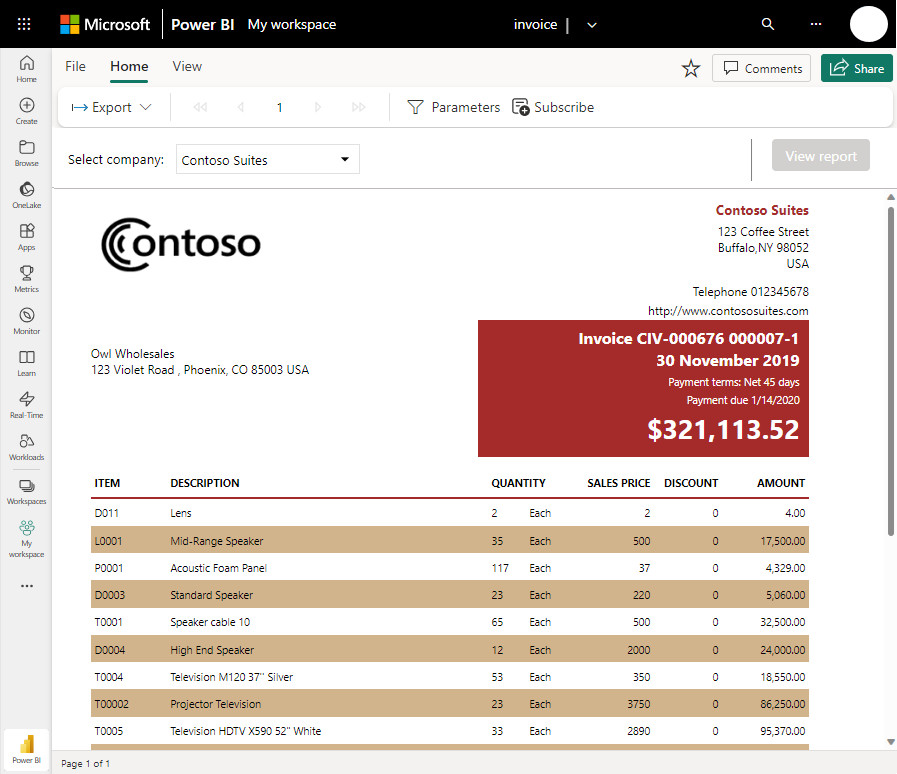
Paginated reports in the Power BI service
Another workflow involves paginated reports in the Power BI service. Enterprise report creators design paginated reports to be printed or shared.
They can also share these reports in the Power BI service.
They’re called paginated because they’re formatted to fit well on a page.
They’re often used for operational reports, or for printing forms such as invoices or transcripts. They display all the data in a table, even if the table spans multiple pages.
Power BI Report Builder is the standalone tool for authoring paginated reports.
On-premises reporting with Power BI Report Server
What if you need to keep your reports on premises, say, behind a firewall? Read on.
You can create, deploy, and manage Power BI reports in Power BI Desktop, and paginated reports in Report Builder, with the ready-to-use tools and services that Power BI Report Server provides.
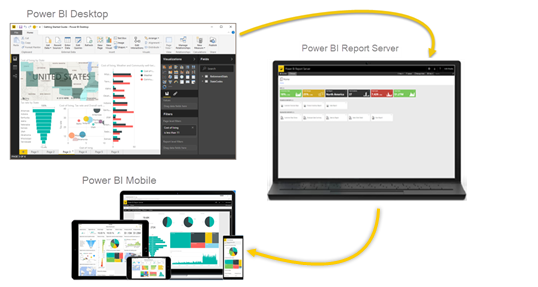
Power BI Report Server is a solution that you deploy behind your firewall and then deliver your reports to the right users in different ways, whether that’s viewing them in a web browser, on a mobile device, or as an email. And because Power BI Report Server is compatible with Power BI in the cloud, you can move to the cloud when you’re ready.